Ballymore/Tubbercurry Electoral Area - Local Elections 2019 - Count Analysis
| Quota | 1999 | Total Valid Poll | 15989 | Seats | 7 | |||||||||||||||||||||||||||||||
| Candidate | Party | Share | Count 1 | Count
2 (Distribtution of D Gallagher's Votes) |
Count 3 (Distribution of Mullarkey's vote) |
Count 4 (Distribution of Taylor's Surplus of 76) |
Count 5 (Distribution of Gallagher's Votes) |
Count 6 (Distribution of Henry's votes) |
Count 7 (Distribution of Feeney's votes) |
Count 8 (Distribution of Queenans Surplus) |
Count 9 (Distribution of Clarke's Surplus) |
Count 10 (Distribution of Mulveys Surplus) |
Status | |||||||||||||||||||||||
| Paul Taylor | FF | 11.8% | 1885 | 1899 | 14 | 2075 | 176 | 0 | 0 | 0 | Elected | |||||||||||||||||||||||||
| Joe Queenan | IND | 10.9% | 1737 | 1763 | 26 | 1773 | 10 | 1775 | 2 | 1806 | 31 | 1822 | 16 | 2158 | 336 | Elected | ||||||||||||||||||||
| Michael Clarke | IND | 9.8% | 1563 | 1604 | 41 | 1615 | 11 | 1615 | 1 | 1664 | 49 | 1693 | 29 | 2076 | 383 | Elected | ||||||||||||||||||||
| Dara Mulvey | FG | 9.4% | 1497 | 1538 | 41 | 1583 | 45 | 1584 | 1 | 1624 | 40 | 1931 | 307 | 2062 | 131 | Elected | ||||||||||||||||||||
| Martin Connolly | FG | 6.3% | 1011 | 1019 | 8 | 1193 | 174 | 1214 | 21 | 1732 | 518 | 1783 | 51 | 1868 | 85 | 1893 | 25 | 1906 | 13 | 1923 | 17 | Elected | ||||||||||||||
| Martin Baker | FF | 9.0% | 1432 | 1472 | 40 | 1510 | 38 | 1521 | 11 | 1535 | 14 | 1793 | 258 | 1821 | 28 | 1869 | 48 | 1895 | 26 | 1902 | 7 | Elected | ||||||||||||||
| Gerard Mullaney | FG | 9.5% | 1523 | 1551 | 28 | 1556 | 5 | 1557 | 1 | 1565 | 8 | 1635 | 70 | 1747 | 112 | 1798 | 51 | 1819 | 21 | 1853 | 34 | Elected | ||||||||||||||
| Willie Gormley | IND | 6.5% | 1046 | 1098 | 52 | 1175 | 77 | 1186 | 11 | 1455 | 269 | 1743 | 288 | 1786 | 43 | 1804 | 18 | 1821 | 17 | 1826 | 5 | |||||||||||||||
| Blair Feeney | FG | 7.5% | 1206 | 1219 | 13 | 1221 | 2 | 1221 | 0 | 1227 | 6 | 1241 | 14 | 0 | Eliminated | |||||||||||||||||||||
| Keith Henry | FF | 6.4% | 1022 | 1050 | 28 | 1092 | 42 | 1109 | 17 | 1146 | 37 | 0 | Eliminated | |||||||||||||||||||||||
| Barry Gallagher | IND | 5.9% | 948 | 998 | 50 | 1097 | 99 | 1109 | 12 | 0 | 0 | Eliminated | ||||||||||||||||||||||||
| Romuald Mullarkey | FF | 4.3% | 692 | 699 | 7 | 0 | 0 | 0 | 0 | Eliminated | ||||||||||||||||||||||||||
| Daniel Gallagher | SF | 2.7% | 425 | 0 | 0 | 0 | 0 | 0 | Eliminated | |||||||||||||||||||||||||||
| Party Share |
|
|||||||||||||||||||||||||||||||||||
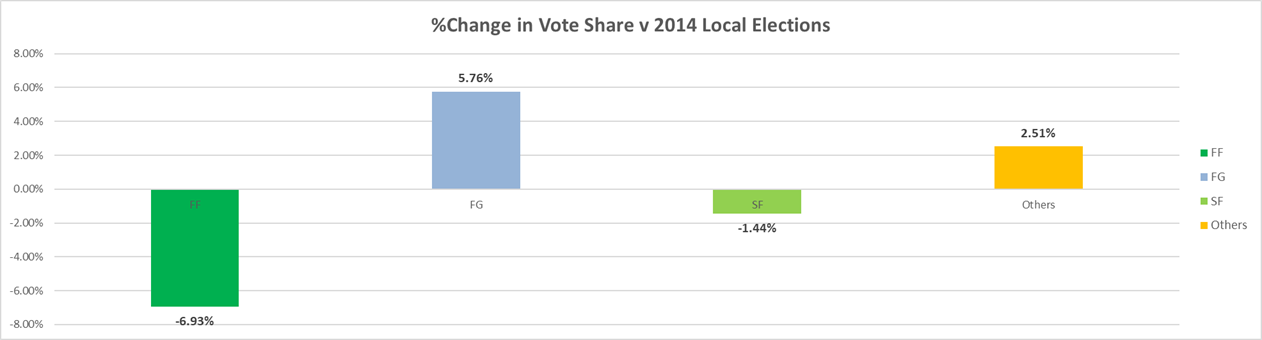
| Party | 2014 | 2019 | Change | Votes | ||||||||||||||||||||||||||||||||
| FF | 38.40% | 31.47% | -6.93% | 5031 | ||||||||||||||||||||||||||||||||
| FG | 27.00% | 32.76% | 5.76% | 5238 | ||||||||||||||||||||||||||||||||
| SF | 4.10% | 2.66% | -1.44% | 425 | ||||||||||||||||||||||||||||||||
| Others | 30.60% | 33.11% | 2.51% | 5321 | ||||||||||||||||||||||||||||||||
|
||||||||||||||||||||||||||||||||||||